☀️ Solar Showdown: A Friendly Energy Face-off
Steve — my longtime friend and neighbor — and I used to occasionally compare notes on our energy use. After both installing nearly identical solar setups, we no longer need to trade utility bills. Instead, we’ve turned our solar production and energy consumption into a daily, automated solar showdown between our homes — a bit of friendly competition that not only keeps things fun, but also gets us checking our own stats more often and thinking regularly about how to be more efficient and environmentally mindful each day.
🎯 How It Works
Every hour, our solar inverters send stats to a shared GitHub data repo, via our home servers (both of us run Proxmox).
At the heart of it is the solarshowdown-api — a lightweight Go service that pulls data from InfluxDB, packages it up as a JSON file, and posts it directly to the data repo.
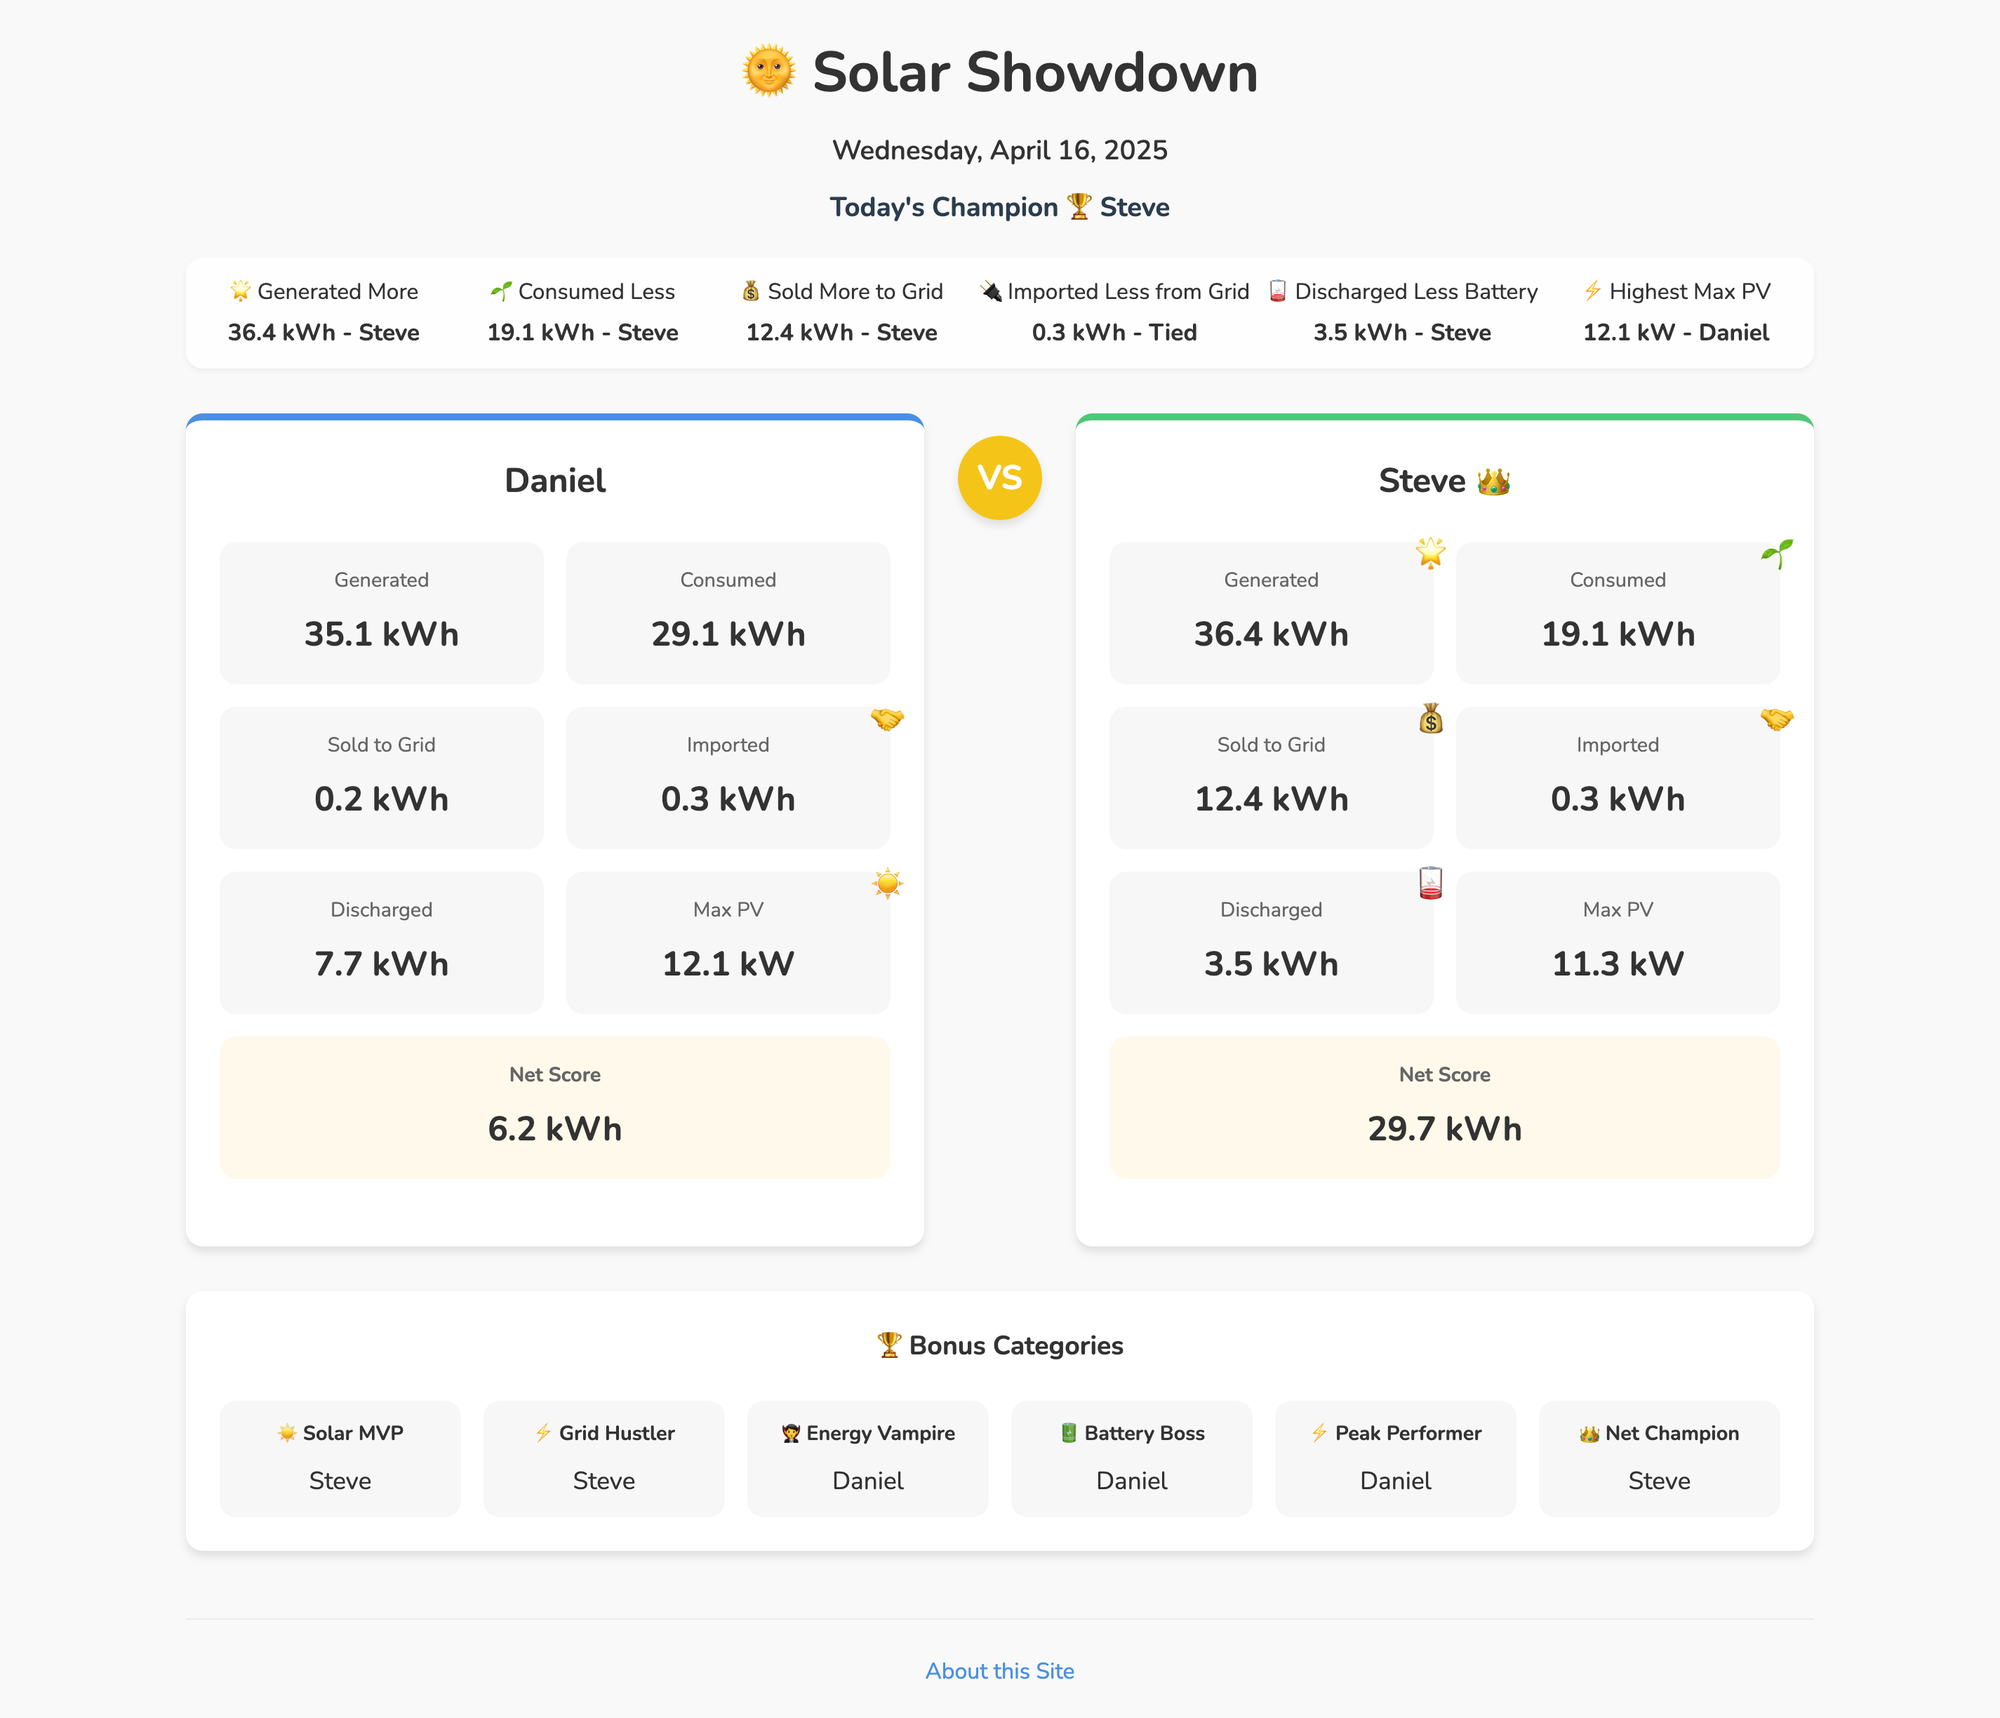
The frontend — a simple, responsive page built with vanilla JavaScript and CSS hosted on GitHub pages — reads from these JSON files and displays a live head-to-head dashboard showing:
- 🌞 Solar Power Generated
- 🌿 Energy Consumed
- ⚡ Energy Sold to the Grid
- 🔌 Energy Imported from the Grid
- 🔋 Battery Discharge
- ⚡ Peak Solar Array Power Generation
🏆 Daily Solar Champion
Each day, the page calculates a Net Score and crowns a champion based on performance. Bonus categories add a twist:
- Solar MVP (most generated)
- Grid Hustler (most sold)
- Energy Vampire (most consumed 😅)
- Battery Boss (most discharged)
- Peak Performer (highest peak)
- Net Champion (overall winner)
And, if you share the link to the page the social preview will update daily via JS — so whoever’s on top gets the spotlight!
📈 About the Project
Want to start your own showdown? Everything is open source, the backend API and frontend are hosted on GitHub.